Once WCSS data have been collected and entered into the Toolkit, the next steps are running the report and acting on the results. This module provides guidance on how to generate a report and interpret the results from the WCSS survey, while the next module suggests steps to improve operational practice based on findings.
Generating the Report
To examine results from a set of completed surveys, use the Dataset Management Tool to review and confirm your recently entered dataset. Note that new datasets from recent WCSS Survey administrations will not be available in the Analysis and Reporting Tool until they are reviewed and confirmed in the Dataset Management Tool. (All tools are located in the Tools and Utilities Module.) Other than a few user preference settings, the Toolkit handles all analysis and reporting automatically.
The Analysis and Reporting Tool produces a brief, easily understood report. The report includes a summary of the results and a detail section. The summary is composed of a single table, a single image, and very brief descriptive narrative. The summary is generally sufficient for most agencies to move on to the action planning stage and act on the results. However, a detailed section is provided in the event more specific results are needed.
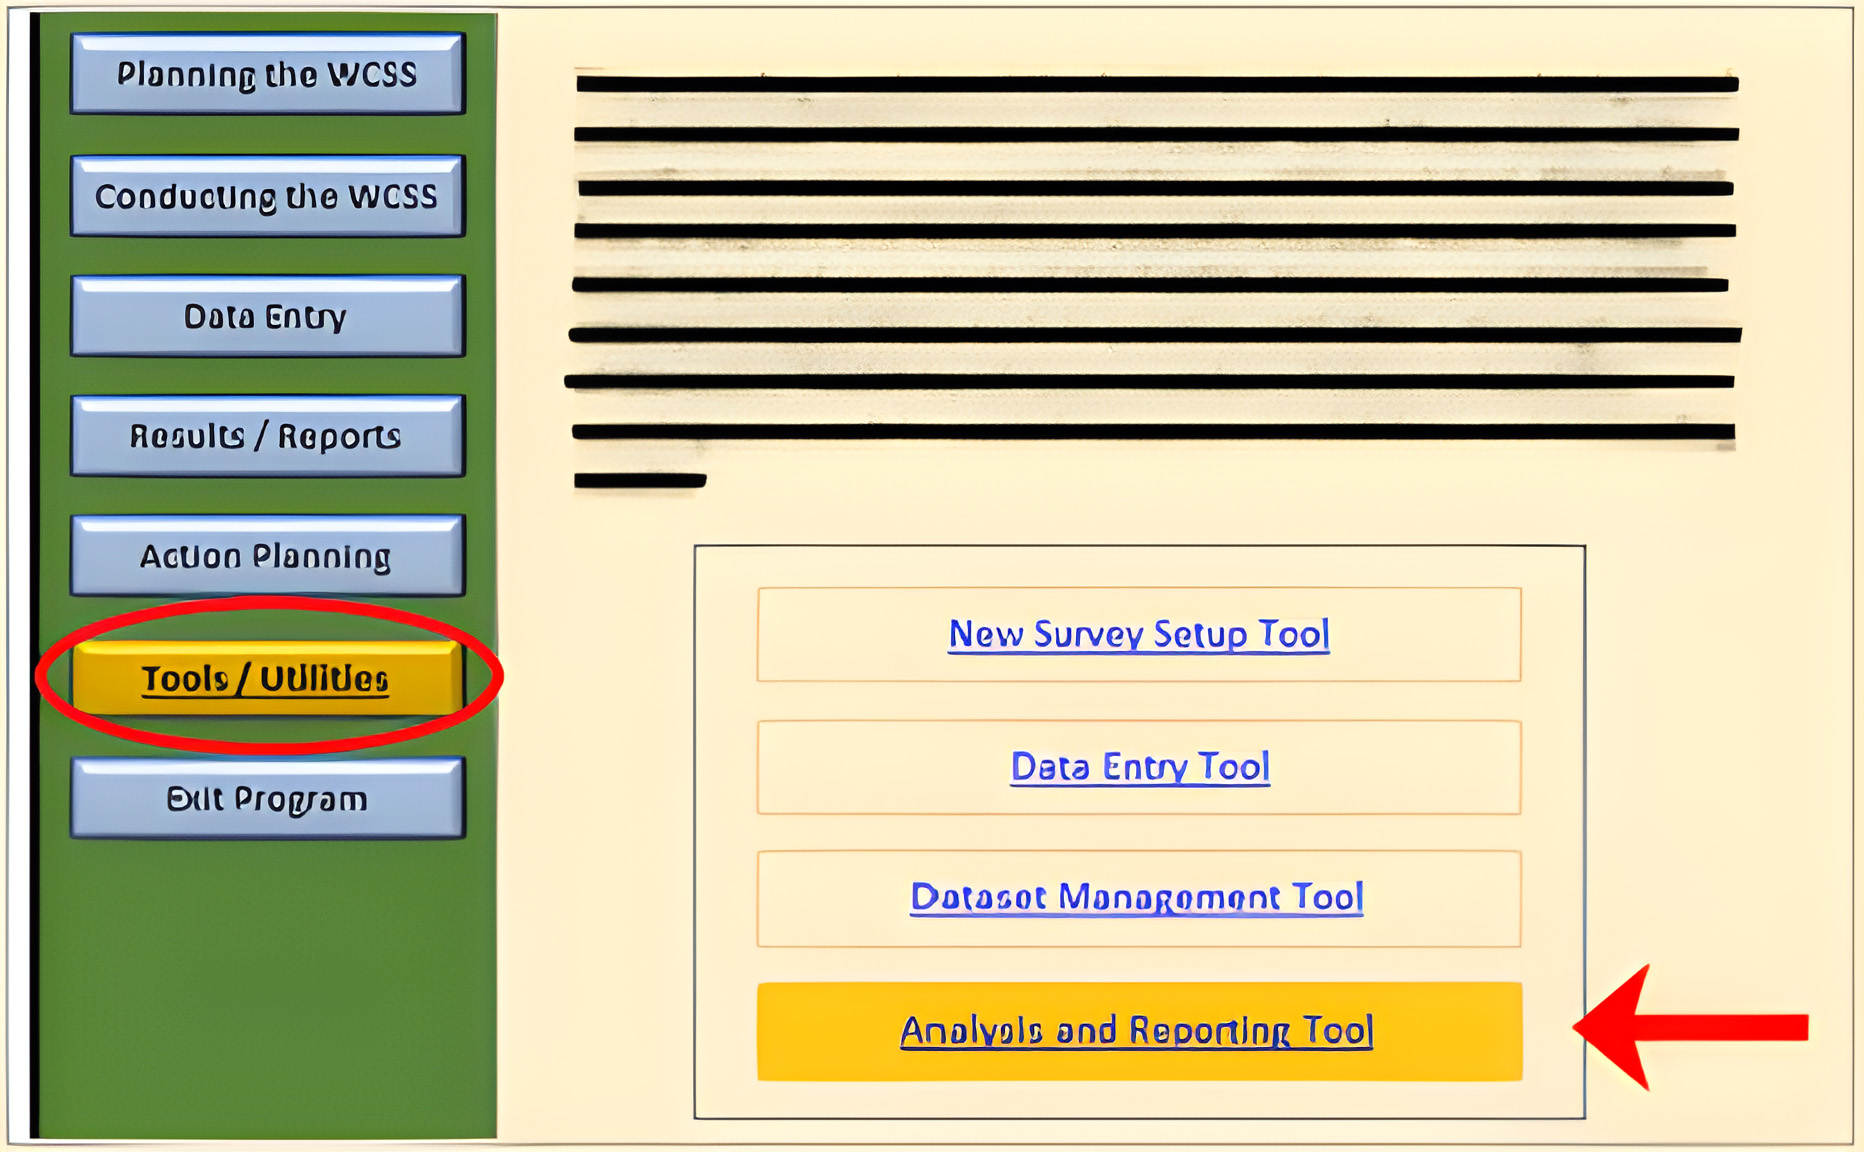
Table 1 provides a summary of results for each housing unit (A-H) surveyed in a fictional facility. Housing unit results appear as columns while survey scale results appear as rows. The WCSS survey includes 14 scales composed of 68 items. For example, the Inmate Physical Violence scale is composed of the following eight survey items:
- Women here have verbally threatened other women inmates with physical violence.
- Women here have gotten into physical fights that started with arguments.
- Women here have gotten into physical fights with other women inmates they did not know.
- Women here have gotten into physical fights with their roommates/cellmates.
- Women here have gotten into physical fights with their friends/others they know.
- Women here have gotten into physical fights with their intimate partners or girlfriends.
- Women here have hit, slapped, kicked or bitten other women inmates.
- Women here have to defend themselves from physical assaults by other women inmates.
Table 1: Summary of WCSS Survey Results (Mean Scale Ratings for each Housing Unit)
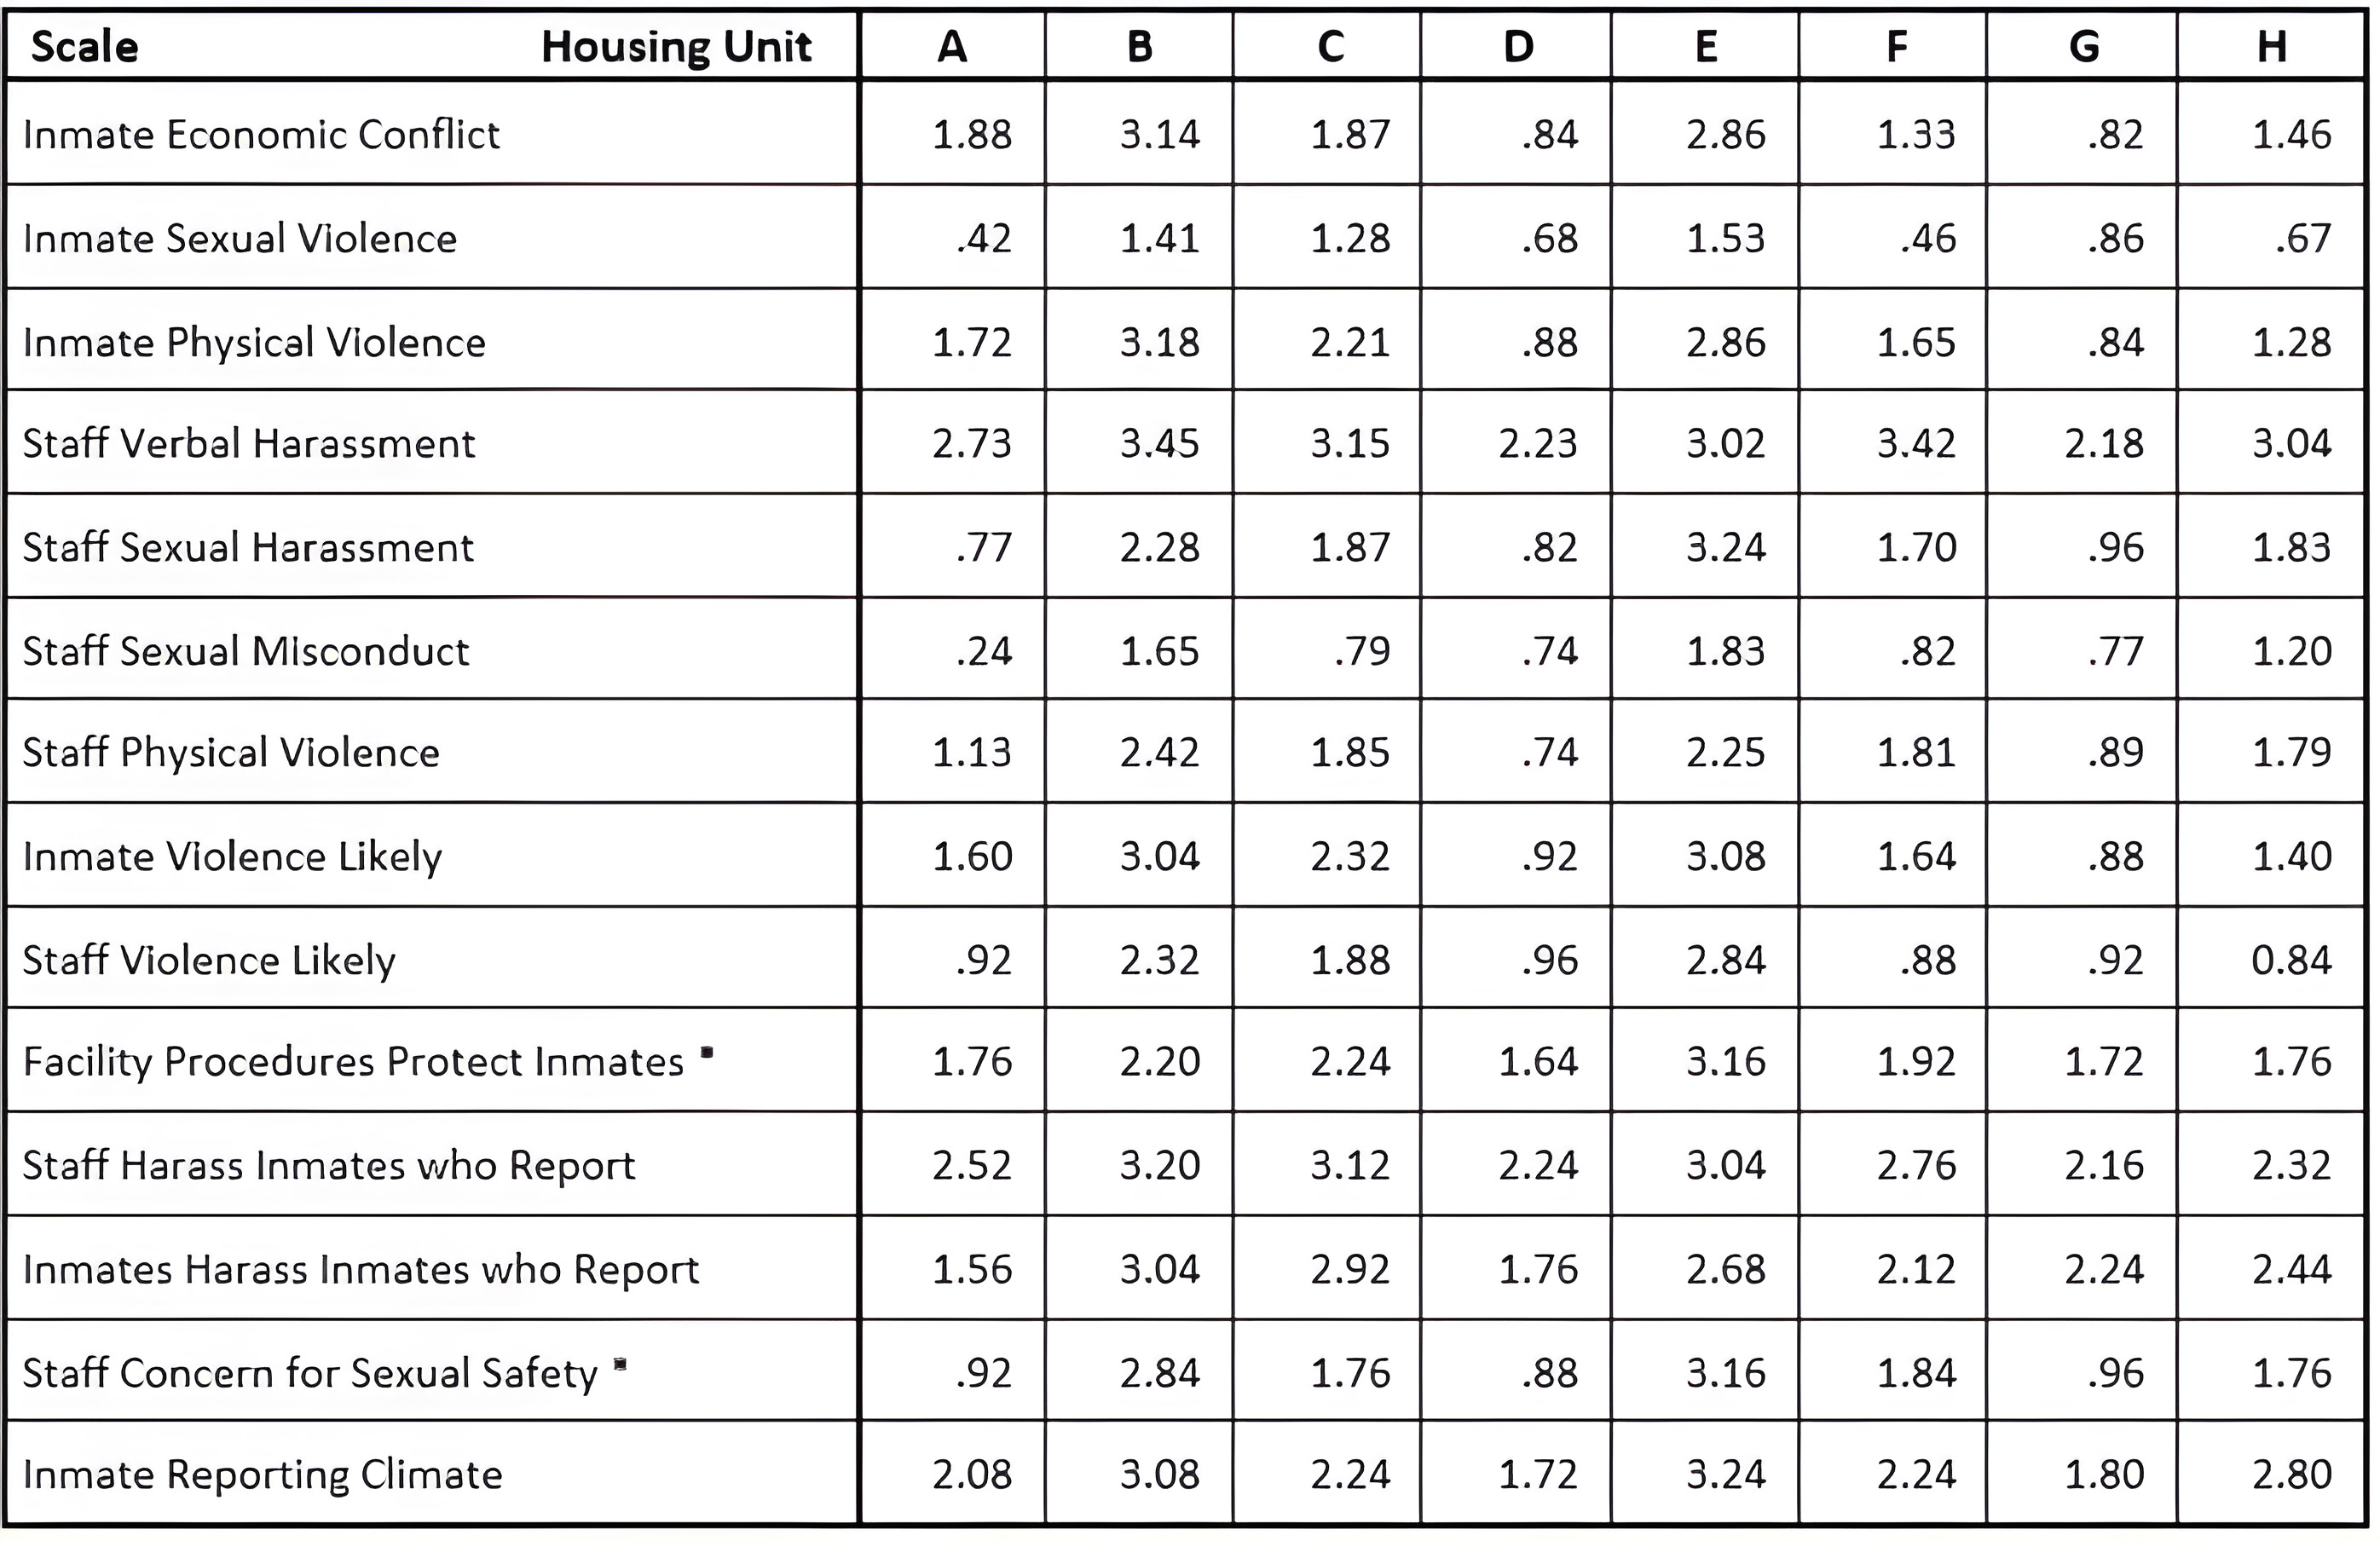
*The survey items that compose these scales were phrased in negative terms and thus were reverse coded so the scale scores would be in the same direction and comparable to the scales composed of positively phrased items.
The mean (average) score for each housing unit on each scale appears in the table cell where the scale row and the housing unit column intersect. The first seven scales on the surveys, starting with Inmate Economic Conflict and ending with Staff Physical Violence, are each composed of multiple items that were rated on a five point "problem" scale ranging from 0 ="not a problem at all" to 4 = "very big problem".
The last seven scales (from "Inmate Violence Likely" to {(Inmate Reporting Climate") are composed of multiple items rated on a five point {(agreement" scale ranging from 1 =strongly disagree to 5 = strongly agree. Some of these items and scales are reverse worded. For purposes of analysis, however, responses were recoded so that mean scores on the last seven scales are more directly comparable with those on the first seven scales, i.e. the range of possible scores for all 14 scales is 0-4 where higher scores indicate bigger problems.
However, it is important to bear in mind that individual experiences vary, and even housing units with very low average ratings may contain one or more women who have experienced serious problems.
Because our example contains results for eight housing units on each of 14 scales, Table 1 provides a concise summary of over 100 important findings and provides the basis for a vast number of relevant comparisons. For example, you can easily compare various housing units to determine which is experiencing bigger problems or look at specific types of problems within housing units or across the entire facility (if you surveyed the entire facility).

Mapping Problem Areas
While quantitative results can be critical in complex efforts to improve correctional safety, it is also important to visualize results to highlight patterns not always apparent in tabular results. To address this challenge, Figure 1 was developed to provide a visual summary of the results in Table 1.
Darker shades in Figure 1 indicate bigger problems. For example, dark vertical columns suggest that housing units Band E, and to a lesser degree C, are more problematic than the other units. On the other hand, the very light columns for units D and G suggest they are the least problematic units. Similarly, the darker rows for staff verbal harassment and the various scales that measure reporting climate suggest inmates feel these areas are generally more problematic than the others. Inmate and staff sexual violence were the least problematic, as indicated by the lighter rows for those scales.

Figure 1: Visual Summary of WCSS Survey Results for each Scale and Housing Unit
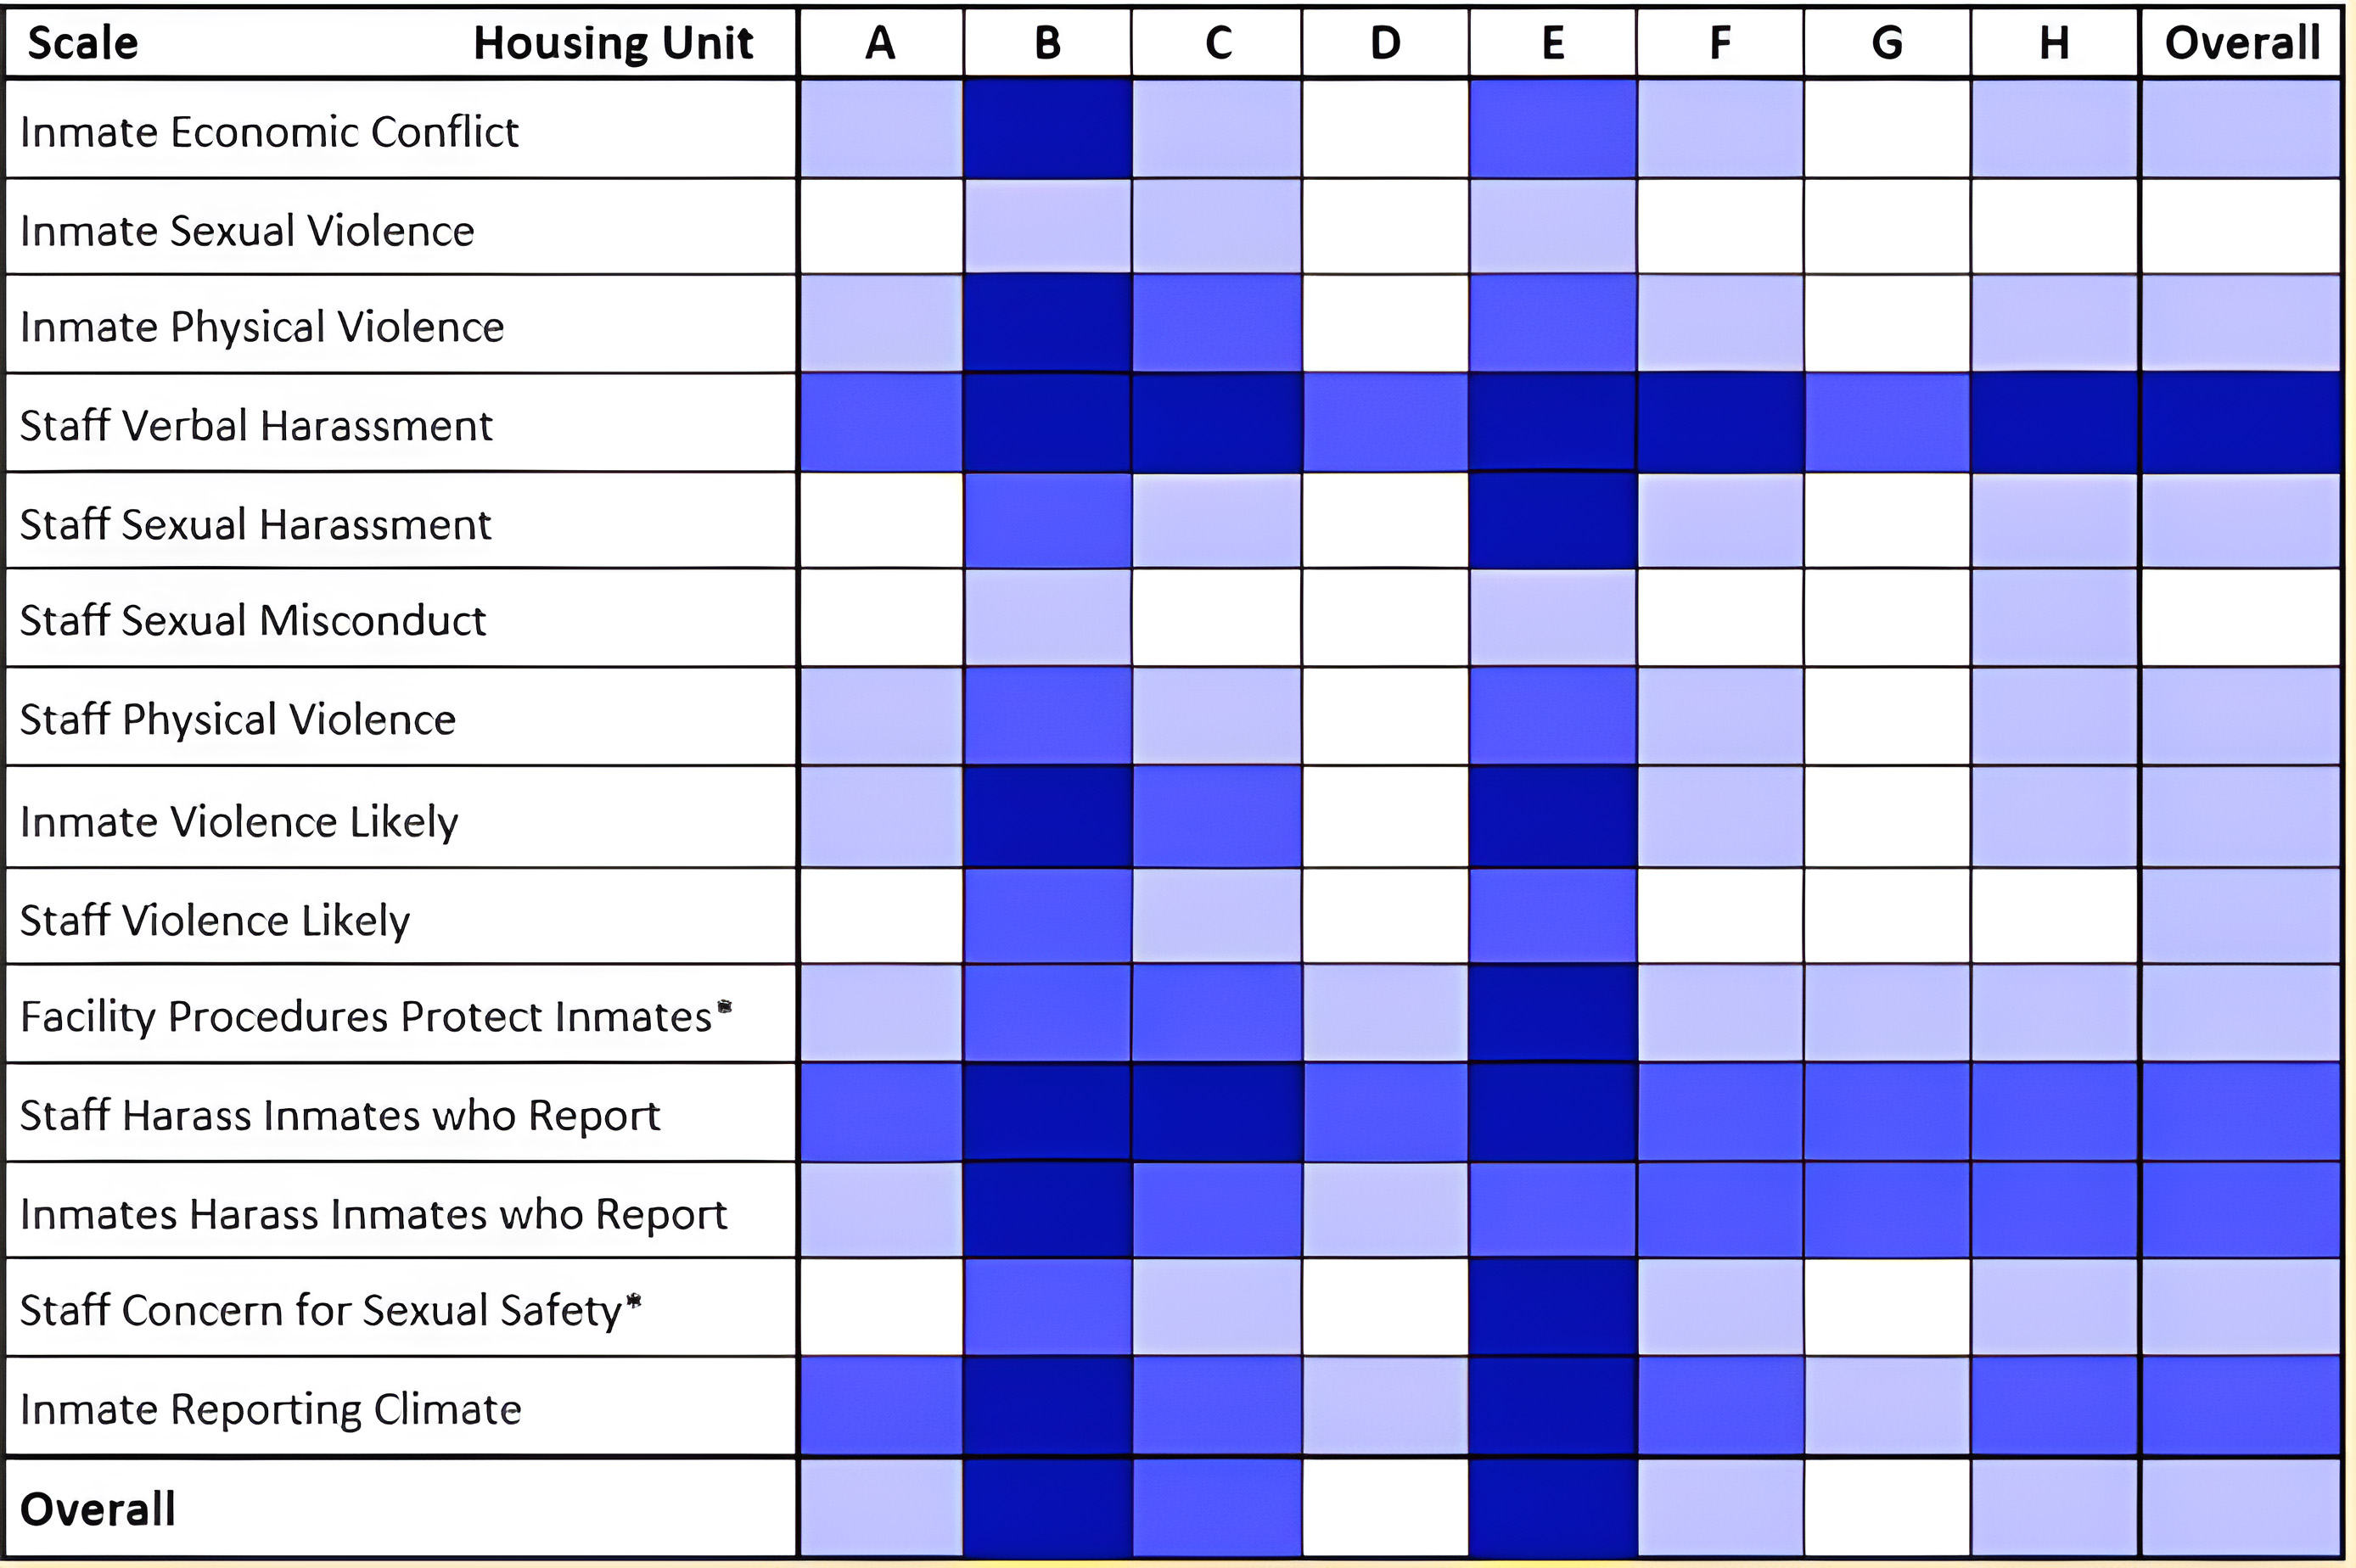
*The survey items that compose these scales were phrased in negative terms and thus were reverse coded so the scale scores would be in the same direction and comparable to the scales composed of positively phrased items.
Note that the original red/green color scheme was revised to a single color "heat map" design to make the image more meaningful to persons with color vision deficiency.
Although Figure 1 is extremely helpful in detecting broad patterns, it can also be very useful for quick spot comparisons, such as comparing specific types of problems in various housing units by looking at specific cells, instead of entire rows or columns.
Detailed Results
The report generated by the Analysis and Reporting Tool also contains a section of detailed results. Although these detailed results are not necessary for interpreting or acting on the results in the summary section, some Facility Teams or researchers may want to review detailed results for the 14 scales or the individual survey items that constitute each scale. In addition to scale and item means, the detailed results also include standard deviations (SD) and number of responses (N). Please note, however, that results in the detail section have not been receded to facilitate direct comparison across all scales, as was done in the summary section. Instead, the detail section contains raw results. It also contains demographic results and results for items on PREA awareness, potential retaliation for taking the WCSS Survey, and other items that were not part of the 14 quantitative scales.
Additional information about the summary section, the detail section, and other elements of the report is provided in the report itself.